The Relationship Between Crude Oil Prices, The Economy, and The Stock Market
Despite recent transitions into renewable, clean, and other green energy sources within the past two decades, crude oil, also called petroleum, has seen a very gradual decline in its global market share as a fuel option. If we dig a little deeper, we can take a look at the numbers behind this.

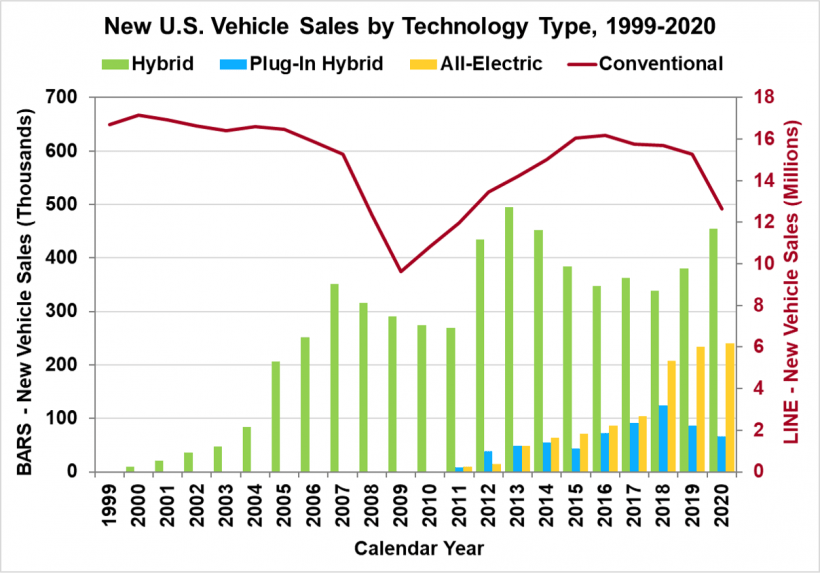
New vehicle sales in the U.S. shows that on average year after year, there is a slow decline in conventical vehicles while the shares for hybrid, plug-in hybrid, and all electric vehicles have all been increasing.
From 1999 to 2020, conventional vehicle sales has dropped from 17 million to about 12.5 million.
From 2000 to 2020, hybrid sales has increased from 9,400 to 454,900. 2010 to 2020, plug-in hybrid sales increased from 300 to 66,200. And all-electric vehicles grew from 10,100 thousand to 240,100. Combined, non conventional vehicle sales in 2020 accumulated to 761,200 vehicles.
Although conventional vehicle sales have been slowly decreasing, they still outnumber non-conventional vehicle sales by more than 12 times.
Globally, there are about 1.4 billion vehicles with 20%~ being in the United States. Within the U.S., there are around 276 million registered vehicles as of 2020. But how many of these vehicles are EVs? How many use oil based fuel as a energy source? When compared to the total number of vehicles, the U.S. Department of Energy shows that there are 1,019,260 registered electric vehicles (2020), with almost half of the vehicles (425,300) being in California alone. This tells us that the number of registered electric vehicles only account for 0.4% of registered vehicles.
Zero. Point. Four. Percent. This number alone tells us that there is still a strong reliance on oil as a fuel source. However, it’s important to recognize that oil is used in more than just one way. It’s also used in consumer goods, such as cosmetics, clothes, and plastics. Oil is objectivity the most important commodity of our modern era. But with the soaring prices that we have seen in the past couple of weeks, what do these changes really effect?
Why is crude oil so important?
Making up 35% of total annual energy consumption in the U.S, petroleum heats our homes, office spaces, business, properties, while providing fuel for transportation and shipping. But that’s not all crude oil can do.
From a single 42 gallon barrel of crude oil: 19.4 is turned into gasoline, 12.5 into distillate fuel (diesel fuel: heavy construction equipment, buses, tractors, buses, boats, trains; and heating oil), 4.4 into jet fuel, 1.5 into hydrocarbon gas liquids (propane, ethane, butane), 0.5 into residual fuel, and 6.5 into over 6000 misc. petroleum products. Some of these products include popular everyday items such as: toothpaste, shaving cream, drinking cups, hair curlers, dishes, pillows, phones, clothes, glasses, and plastics.
Who are the largest oil producers in the world?
As of 2020, the top ten oil producing countries 72% of crude oil to the world, 67.49 million barrels per day out of the total 93.86 million. The United States produces the most at 18.61 million barrels per day, 20% of the global market share followed by: Saudi Arabia (10.81m, 12%), Russia (10.5m, 11%), Canada (5.23m, 6%), China (4.86m, 5%), Iraq (4.16m, 4%), United Arab Emirates (3.78m, 4%), Brazil (3.77m, 4%), Iran (3.01m, 3%), Kuwait (2.75m, 3%). These top ten countries account for 72% of the oil produced in the world.

What about OPEC?
Founded in 1960, the Organization of Petroleum Exporting Countries, or OPEC, is a cartel of oil producing countries that determine the amount of oil that gets supplied to the world. Currently there are thirteen countries that make up this cartel which consist of Algeria, Angola, Republic of the Congo, Equatorial Guinea, Gabon, Iran, Iraq, Kuwait, Libya, Nigeria, Saudi Arabia, United Arab Emirates, and Venezuela. Since 2017, OPEC has expanded their alliance to include other oil producing countries without them formally being part of the cartel. These additions include Azerbaijan, Bahrain, Brunei, Kazakhstan, Malaysia, Mexico, Oman, Russia, South Sudan, and Sudan. Of the top 10 producing countries in the world, six are a part of OPEC+. These countries are Saudi Arabia, Russia, Iraq, United Arab Emirates, Iran, and Kuwait; accounting for 37% of the 72% share of world total.
Who are the worlds largest oil consumers in the world?
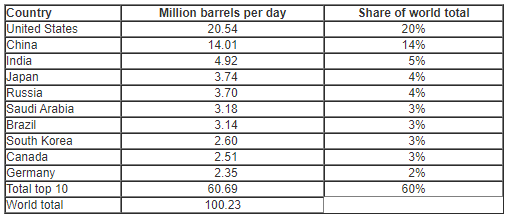
The United States tops the list again consuming 20.54 barrels of oil a day at 20% of the world total followed by: China (14.01m, 14%), India (4.92m, 5%), Japan (3.74m, 4%), Russia (3.7m, 4%), Saudi Arabia (3.18m, 3%), Brazil (3.14m, 3%), South Korea (2.6m, 3%), Canada (2.51m, 3%), Germany (2.35m, 2%), and Germany (2.35m, 2%). These top ten countries account for 60% of the worlds consumption of oil.
How is crude oil priced?
Like most things, a contributing factor that determines the price of oil involves supply and demand. As there is more oil being supplied into the market, the price of oil goes down. If the supply of oil goes down, the price of oil goes up. Since oil is a commodity, commodities deal in the futures market via futures contract.
These contracts are binding agreements that give the contract buyer the ability to purchase barrels of oil at a predetermined price at a predetermined date in the future. Buyers of these contracts are able to trade them until end of the front month (nearest expiration date). Expiration dates vary depending on the contract. For crude oil, there are monthly expiration dates that go as far as nine years. Whoever hold these contracts at or past contract expirations is obligated to accept the barrels of oil while the seller of the contract is obligated to sell them to the buyers. The actual price of crude oil is determined in a global market place and is not determined by any single entity.
The pricing for these contracts would look similar to a log graph (see below), where the spot price of the commodity is lower than the future prices (contango):

When the forward price of a futures contact is higher than the current spot price, it means that the market is in contango. Future prices may be in contango due to factors such as insurance, shipping, storage, and even financing. Prices may change as the views of market participants may change.
On the other hand, there is the inverse of contango which is backwardation.
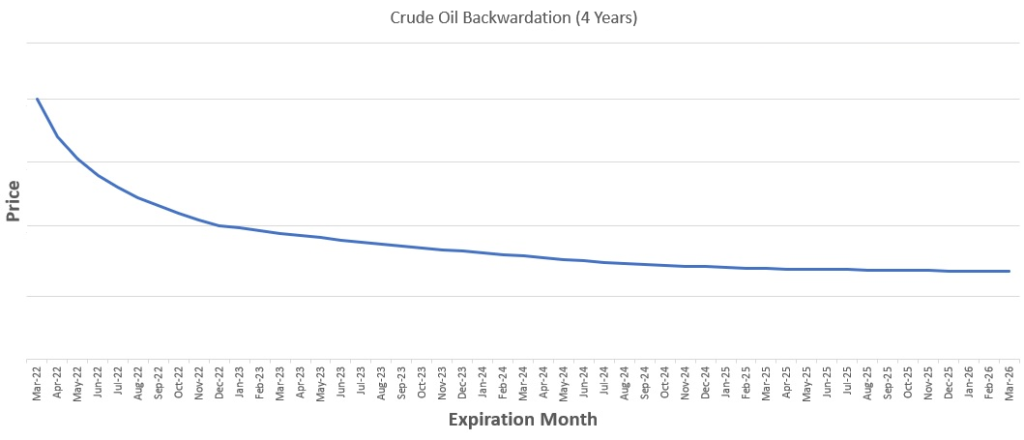
With backwardation, the spot price of the commodity, in this case crude oil, is higher than the future price of the product resulting in a downward sloping curve. Backwardation might occur because it might be more beneficial to take physical deliveries.
As time passes by, the price of the futures contract will begin to converge with the spot price.
So what’s the relationship between oil and the economy?
As a quick reminder: when refined, a 42 gallon barrel of crude oil turns into fuel for automobiles, trucks, planes, heating and energy for buildings, industrial machinery, and made into consumer products such as cosmetics, plastics, and clothes.
When the price of crude oil goes down, businesses and consumers spend less on transportation and can take advantage of lower gasoline prices. Businesses are able to reallocate that money into reinvestments, hire more workers, and maximize productivity. Consumers are able to go out into the local economy more often, spending on goods and services that gets recirculated. In short, lower crude oil prices help stimulate the economy.
However, when the price of crude oil goes up, it causes the economy to slow down. When crude oil prices increase, that means transportation is more expensive, goods get more expensive, utilities get more expensive. Businesses that get their goods transported from different regions in their country, or even world, need to allocate more of their money towards expenses. These expenses then gets translated into the increasing price of their goods or services, essentially passing along the cost into the consumers. Because these goods and services have increased in cost, consumers would tend to buy less and use services less. Higher crude oil prices also means higher cost of fuel and energy, therefore consumers travel less, being unable to spend their money in the local economy.
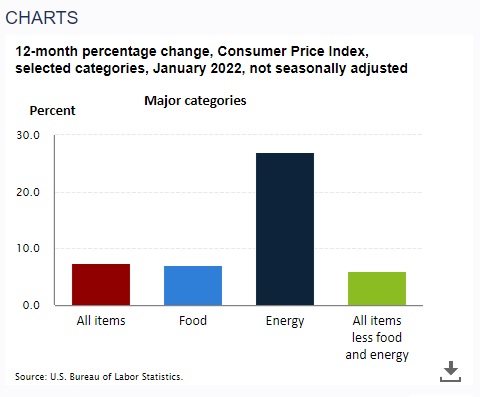
The increase and decrease in the price of energy is one of the major categories used to calculate the consumer price index (CPI) number by the U.S. Bureau of Labor Statistics (BLS). CPI is commonly used as an indicator for inflation. As of writing this post, the most recent CPI number released by the BLS is +0.6% month over month and +7.5% year over year. This means that on average, prices have increased by 0.6% from December 2021 to January 2022 and 7.5% from January 2021 to January 2022.
Energy as general category has increased by +0.9% month over month (Dec 2021 – Jan 2022) and a astonishing 27% year over year (Jan 2021 – Jan 2022). Gasoline has actually dropped by -0.8% month over month but almost doubled by 40% year over year.
Then what’s the relationship between crude oil and the stock market?
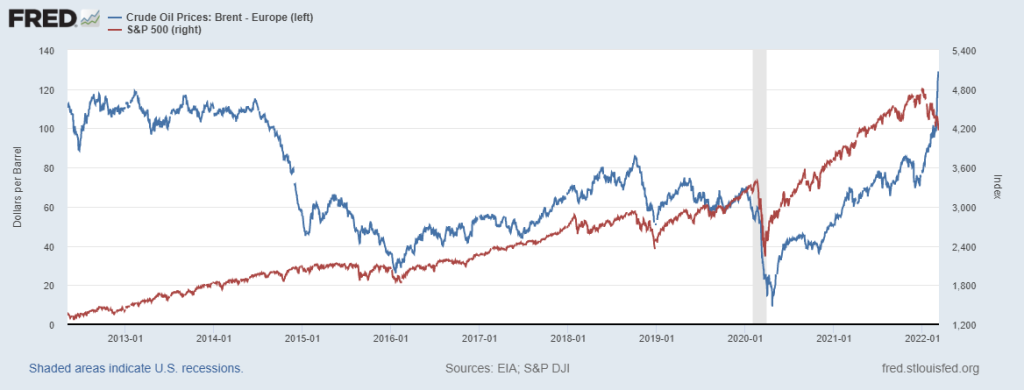
There is a common belief amongst investors that high oil prices negatively affect the stock market. It makes sense right? Increasing cost of fuel would tighten company profit margins due to higher cost of inputs. Rising cost of fuel would also have an impact on inflation and spending habits of consumers. But let’s take a step back and remind ourselves that correlation is not causation and that the economy is not the stock market.
Back in 2008, the Federal Reserve Bank of Cleveland conducted a study on the correlation between the price of oil and the growth of the S&P 500. Researchers plotted weekly price changes between the two since the beginning of January 1998 to August 2008. If higher prices of oil did affect the stocks, in this case the S&P 500 index, there would be a downward sloping line to indicate an inverse relationship.

If we took a look at the Crude Oil Price and S&P 500 graph gathered from the St. Louis Fed at the top of this section, we can see that there is a positive correlation between the two since 2016. It’s possible that the reason for this similar movement was due to shifts in global demand, which affects both corporate profits and demand for crude oil. According to former Federal Reverse Chairman Ben Bernanke, “sometimes the price of stocks and oil move in the same direction…on average, however, the correlation is positive.” The underlying demand factor of oil does account for a positive relationship between oil and stocks. With this being said, there is still many significant factors that are unexplained.
One sector that does have a strong inverse correlation with the spot price of oil is transportation. As fuel is the highest input cost for these businesses such as the airline industry, investors tend to pile into these stocks when oil is low and sell when oil is high.
Another sector that has a obvious relationship with the price of energy is the energy sector itself. When energy prices go up, the energy sector is able to profit off of these price increases. Their earnings are usually better during these times so investors buy when energy increases and sell when energy falls, therefore having a positive correlation.
great publish, very informative. I’m wondering why the other experts of this sector don’t realize this. You must proceed your writing. I am sure, you have a huge readers’ base already!
Comments are closed.