Skip to content

When Money Grows On Trees: Using Cash Secured Puts To Generate Income

Imagine this: you just earned your drivers licenses after passing both DMV test and decide to purchase a car to celebrate your accomplishment. But before you are allowed get on the road, you need to buy some car insurance first (as required by most states). The insurance premium that you pay for protection is meant to be reassurance to you that if something were to happen while you were driving your vehicle, you would get some type of financial reimbursement for the incident. Of course you never actually want any type of scenario to happen to you or your car; but in case something ever does happen, having bought that car insurance gives you a sense of safety knowing that you are covered.

But now what if you’re on the other side of this transaction and instead of being the driver buying insurance, you are the salesman selling it. You need to determine what the risk is going to be like to insure this new driver, what car type and make they are driving, along with a multitude of other factors that will be used to figure out the premium and their own preferences for deductibles.

This is essentially what you are doing with cash secured puts. You are selling insurance to the put buyer according to the risk that is associated with the contract such as the Greeks, implied volatility, and chance of profit/ likelihood of being in the money. By doing so, you are giving them the reassurance that if the underlying stock falls to or below the strike price of the contract, you will buy their shares no matter how low the stock is at expiration, even if it reaches $0. In return for this reassurance, you collect the premium from selling puts to the buyer.

By using cash secured puts intelligently, consistently, and effectively, you will be able to generate extra monthly income for yourself on a yearly, monthly, weekly, or daily basis depending on your personal time frame.

What are cash secured puts?

Cash secured puts is a options strategy where you are selling puts in order to collect premium from the buyer of the contract. This is similar to the covered call strategy, where you are required to own 100 shares per contract you decide to sell so you are able to collect premium from the buyer.

The main difference between these two strategies is that you don’t own any shares of the underlying stock when you use cash secured puts. Instead, you need to have enough capital to put up for collateral in order to have the ability to purchase 100 shares per contract you sell if the put contracts were to ever be at the money or in the money during expiration. Remember, a put option contract gives the buyer the ability to sell 100 shares of the underlying stock to the put seller as long as the contract when conditions are met. This is why as a put seller, you need to have enough collateral to purchase those shares at the agreed upon price if the underlying is in the money by expiration.

Let’s dive into some examples to illustrate what I am talking about here using the Robinhood platform due to its friendly UI/UX. As of cash close on Monday, April 5, 2022, $SPY (S&P 500 ETF) closed at $451.03.
$SPY put options chain on April 5, 2022 via Robinhood

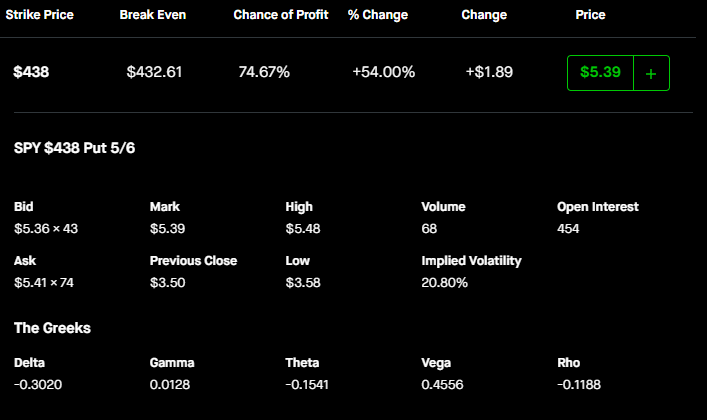
The reason why I chose this $442 strike expiring May 6 is because of its negative 30 delta that is expiring a month out (30 days). A 30 delta roughly means that there is a 30% of the contract being in the money at expiration.

Short put on $SPY P/L calculation for $438p May 6 via OptionStrat. Black dotted line represents current price of $SPY and blue line represents break even point while x-axis represents $SPY spot price with y-axis represents P/L.

Say you sold this contract, you would be collecting $539 ($5.39 * 100 due to options multiplier) in premium from the buyer. Your max loss for this trade is theoretically $43,261 if $SPY were to ever go straight to $0 (not likely to happen due to the nature of $SPY). Because you sold this contract, and assuming you don’t buy it back, you would need to purchase 100 shares per contract sold at the strike price of $438. Since you also collected the premium from the buyer for the contract you sold, you knock down your price price of $43,800 by $539 to $43,261. Therefore, your max profit for this trade is $539.

Notice how this strategy is different compared to a long put where the strategy involves you purchasing puts instead of selling them.
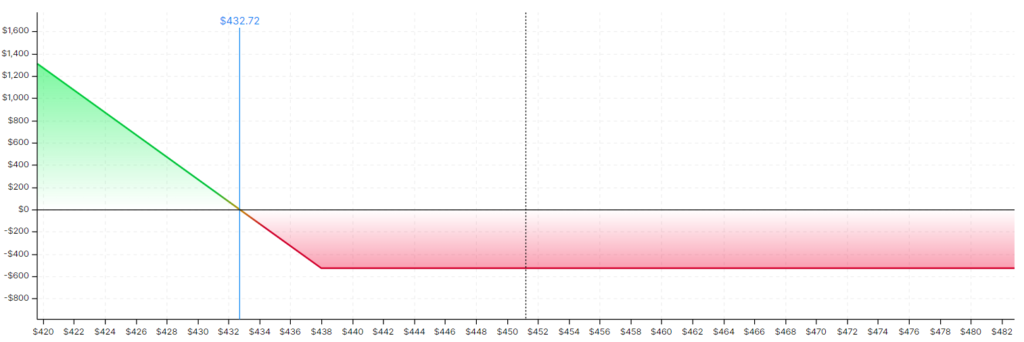
Long put on $SPY P/L calculation for $438p May 6 via OptionStrat. Black dotted line represents current price of $SPY and blue line represents break even point while x-axis represents $SPY spot price with y-axis represents P/L.

Theoretically for this trade, as the put buyer, you are paying $539 for this contract for the ability to make $43,261 if $SPY were to go to zero. Remember that as a buyer, the options tend to be over priced and is against you. The chance of this going to going in the money is about 30% while the chance of the options seller profiting the entire $539 is 75%.

Let’s use a different example where the underlying stock is in the double digits instead of the triple digits. As of cash close on Tuesday, April 5, 2022, $FCX (Freeport-McMoRan Inc) closed at $49.09.
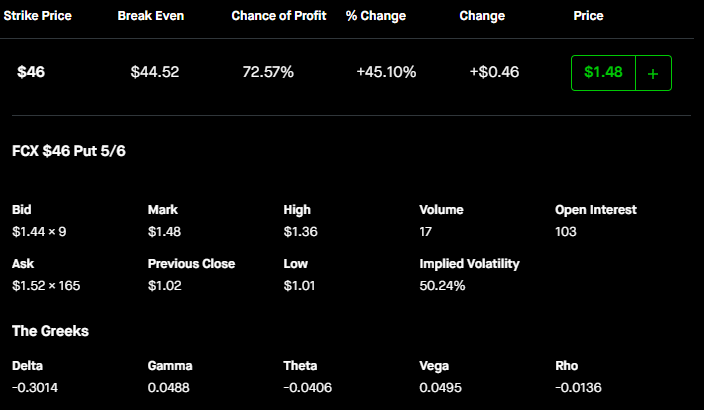
$FCX put options chain on April 5, 2022 via Robinhood.

One month out (30 days) $46p May 6 cost $148. To sell this one you would need to put up $4,600 for collateral. Doing this for one month successfully would increase your position by 3.2% ($148/$4,600) which means doing this for one year would increase your position percentage by 38.4%, almost three times higher than the average growth of the $SPY. Or, in other words, an extra $148 in income per month.

Note: Some numbers on Robinhood and OptionStrat are a bit different. I decided to stick with the numbers from Robinhood for consistency and left OptionStart graphs to visualize what the P/L would roughly look like.

Why would I use cash secured puts?

As demonstrated in the previous example with $FCX, using cash secured puts consistently and successfully on a monthly basis (or whatever time frame you’re working with) can either help you generate extra income or even outperform the market. But that’s not all cash secured puts can help you do.

Say you actually are looking at $FCX and from the thesis you have built you would like to have some exposure in this company. However, you think that the current price is overvalued and would prefer to have a lower entry. You have concluded that a reasonable price to enter this stock due to it’s one year trading range is at a high of $43 and low at $36. Looking at the $43 strike price with all else being equal:
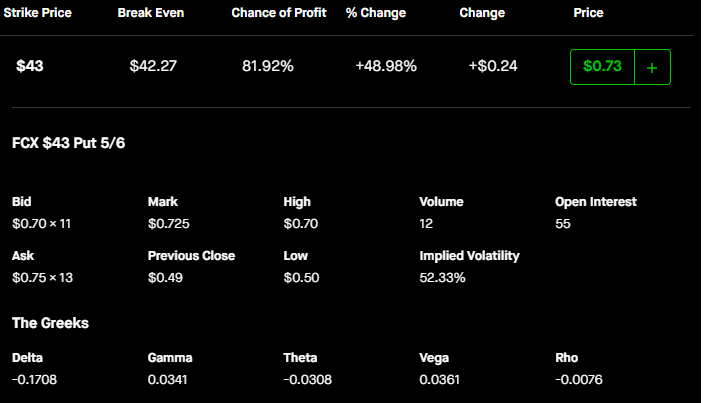
$FCX put options chain on April 5, 2022 via Robinhood.

we can see that this contract cost $73 each. If they go up in value before you are able to open a position for exposure, that’s fine because you were able to make a gain. If you still wanted to open a position because you strongly believe in your thesis, then just adjust the contract accordingly. Of course if you were a bit impatient you can move the contract you decide to sell closer to the money so you are able to collect higher premium along with a higher chance of being assigned the shares, ultimately reducing your cost basis.

Another way you would implement this options strategy is when you expect the underlying stock you are holding in your long term portfolio to go down and would like to both reduce your average cost and increase your exposure. You would sell puts on the underlying so you are able to reduce your cost basis and increase your holdings. This is great because timing the market is incredibly difficult to do and it is much more simple to have these contracts out and execute for you. If you happen to be wrong with your duration that’s fine because you got to collect premium and can do it all over again.

So how do I actually generate income using cash secured puts?

Depending on which ticker you are looking at, you would need to calculate how much it would cost you to buy 100 shares of the underlying stock so you know how much you need to put up for collateral. So if you were to have sold the $SPY $400p, you would need to have $400*100= $40,000 in your brokerage account to put up for collateral. If you sold the $FCX $40p, you would need to have $40*$100=$4,000 in your brokerage account for collateral; so on and so forth.

To execute this type of trade, you would want to look for contracts that are about 30 delta with 30 days from expiration. A 30 delta roughly means that the contract being sold has a 30% chance of being in the money by the time of expiration while selling the 30 day out contract allows you to take advantage of the exponentially decay of extrinsic value from these contracts. If your risk tolerance is higher then sell a higher delta, if lower tolerance than sell a lower delta.

You would also want to be aware of what the historic IV is for the ticker you are looking at and what the IV is currently at. Because you are selling contracts, you would want to capitalize on high IV so you are able to collect higher premiums. To find out what these numbers are, you can use resources such as Market Chameleon to help you. Another trick is to make sure that you have done your research on the underlying. Things like earnings, catalyst, trading ranges, and if the stock is trading at historical highs will all have an impact on the outcomes and pricing of your contracts.

Summary of cash secured puts

Cash secured puts is a short put options strategy that can help you outperform the market, generate extra income, or reduce your cost basis. As a put seller, you are essentially selling insurance to the put buyer. In exchange for premium, you are agreeing that you will purchase the underlying stock no matter how low the price of the shares fall to.

When you decide that you want to start using this strategy, consider the following:

  • Take into consideration what the historical IV is and where it is currently.
  • Do research on the company and look for catalyst.
  • Take note of ER dates
  • Understand what range the stock is trading.
  • Pick tickers where you do not mind holding for a lot time in the scenario where you end up getting assigned.
  • Sell contracts according to the delta (depending on your own risk tolerance) which are about one month out (30 days) in order to take advantage of exponential extrinsic decay.

When Money Grows On Trees: Using Covered Calls To Generate Income

1 Comment

For most individuals that are starting their journey into the equities market, they either begin with purchasing shares of a company, index fund, ETF, or a mixture – then proceed to hold onto these share for the long term, and dollar cost average into their position while they (hopefully) appreciate in value. However, during the past decade something miraculous changed: the introduction of commission free trading due to popular brokerage apps such as Robinhood effectively revolutionizing how the equities markets operate, especially for the retail investor. Then came the introduction of options trading in December 2017 on the Robinhood platform, opening doors that would allow anyone with an account to leverage themselves as much as could tolerate.

Retail investors on the Robinhood platform could now either open a call position, if they are bullish, or puts, if they are bearish, based on their thesis. And for most individuals that are using any brokerage service, their education about options tend to stop here – aside from maybe learning about the Greeks, which are used to determine the price of any options contract. But what happens when instead of buying these contracts, you are on the opposite side of the trade and actually sold them instead? Due to its simplistic nature, the covered call strategy is usually one of the first options strategies recommended for beginners, and when used correctly could help you generate extra monthly income.

What are covered calls?

Before diving into what covered calls are, let’s first take a step back and give ourselves a quick reminder about what a call option is. A call option is a bullish position where you are purchasing a call contract for the right to purchase 100 shares of the underlying stock, as long as the underlying stock either reaches, or surpasses your strike price at or before expiration. This position has theoretically unlimited profit potential with the risk of losing all the money you spent to buy this contract, also called the premium. On the other side of this trade, if you are the seller of the call option contract, you are selling the right to give the buyer the opportunity to purchase your 100 shares of the underlying as long as the underlying stock hits or surpasses the strike price at or before expiration. By doing this, you are agreeing to limit your upside potential with the shares you own in exchange for the premium paid by the call option buyer. If these requirements don’t happen, the call options seller keeps both their 100 shares and premium collected from selling the contract.

Now let’s illustrate what I’m talking about by using some real examples with $SPY from the Robinhood platform. As of cash close on Friday, March 25, 2022, $SPY closed at $452.69.

$SPY call options chain on March 25, 2022 via Robinhood

I chose the $463 strike price because its delta is at 30 and the April 25 expiration date since it is a month out, giving us 30 days until expiration.

Long call on $SPY P/L calculation for $463c April 25 via OptionStrat. Black dotted line representing current price of $SPY and blue line representing break even point. x-axis representing $SPY spot price with y-axis representing P/L.

If you were to purchase this contract, you would need to pay $352 in premium due to the options multiplier ($3.52 * 100 = $352). Your max loss is the amount of money you paid for this contract, which is $352, and your profit potential is theoretically unlimited. Even if $SPY hits $463 at the time of expiration and you get the right to purchase 100 shares of $SPY, you still need $SPY to reach $466.52 in order to break even at expiration (as shown with the graph above).

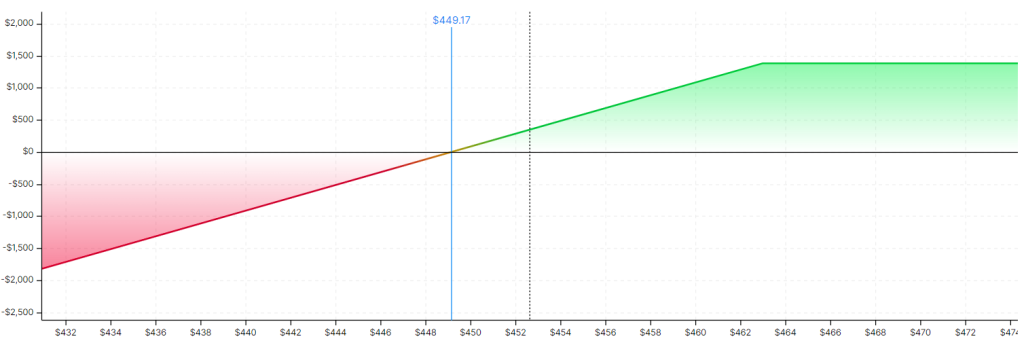
Covered call on $SPY P/L calculation for $463c April 25 via OptionStrat. Black dotted line representing current price of $SPY and blue line representing break even point. x-axis representing $SPY spot price with y-axis representing P/L.

On the other side of that trade you have the seller that is collecting premium. But since we are talking about a covered call strategy here, the seller would also need to purchase 100 shares of $SPY ($452.69 * 100 = $45,269) in order to protect themselves. Selling this call option contract would net the seller $352, reducing the cost basis for this strategy to $44,917. The max potential loss for this would be the full $44,917 while the max potential profit would be ($352 + (($463 – $452.69) * 100)) $1,383. While the idea of losing $44,917 is mind boggling, the chance of that happening is near zero unless it’s the world is ending. Also notice here that the break even point is at $449.17 since the seller collected the $3.52 in premium ($452.69 – $3.52 = $449.17). Collecting premium reduces the sellers cost basis.

What happens if I don’t own the shares and the contract gets exercised/ shares are called?

What makes this a covered call strategy is that you are covering yourself because you actually own 100 shares of the underlying stock in order to protect yourself while selling a call. If you do not own the 100 shares of the underlying you are participating in something called a naked call, also known as a short call, where you are selling the contract without owning any of the shares you are promising to sell to the buyer. Using the same example as before, your max profit is $352 while your potential loss is theoretically infinite. As the saying goes, you’re “picking up pennies in front of a steam roller.”

Short call/ naked call on $SPY P/L calculation for $463c April 25 via OptionStrat. Black dotted line representing current price of $SPY and blue line representing break even point. x-axis representing $SPY spot price with y-axis representing P/L.

If $SPY were to hit the strike price of $463 and the contract was exercised, as the call seller you are now obligated to sell the call buyer 100 shares of $SPY at $463. So if you did not own the said 100 shares of $SPY already, that means you would need to spend $46,300 to purchase the shares so you can sell them back to the call buyer. The worse case would be when $SPY goes beyond that $463 strike price. For example, if $SPY hit $475, you would need to purchase 100 shares of $SPY at $475 and then are still obligated to sell those same 100 shares to the call buyer at $463. This would be a loss of $1,200.

Why would I use covered calls?

The covered called strategy is multi-purpose depending on how you decide to use it.

In the scenario depicted above within the “What are covered calls?” section, you would use the covered call strategy to initiate a position you plan on holding for a short period of time with the intention to trade. Ideally, the call you sold would either be at the money or in the money by the time the contract expires, allowing you to sell the shares for the agreed upon price as well as keeping the premium. The ability to collect premium allows you to both: have downside protection by reducing your cost basis if the stock drops in value and allows you to squeeze more money if the underlying appreciates to or above the strike price. You would not care about how high the underlying stock appreciates in value because your covered call position is complete.

Another scenario you would use covered calls for is when you want to begin devesting your positions. Say you bought 100 $SPY shares back when it was $300 and now you feel comfortable enough to sell at $452.69; that is a gain of 50.9%. Instead of selling your shares, you could instead sell calls to squeeze additional money from your position. If the underlying doesn’t hit your strike price, you get to do this over again until the contracts get exercised. So instead of that 50.9% gain, your returns would actually be much more. If this is your intention and you want to ensure that your shares get called, you would gravitate towards higher delta options.

A third scenario would be if you wanted to reduce the cost basis on your position with the intention of holding for the long term. For example, if you wanted to hold $SPY shares for the long term and you purchased them at it’s current price of $452.69, you could sell the 30 delta monthly call on a monthly basis for $3.52. If you successfully did this for a year and managed to collect premium without the shares being called, (12 * $3.52 = $42.24) you would have reduced your cost per share from $452.69 to $410.45.

It’s also interesting to note that the Chicago Board Options Exchange (CBOE) created an index (BXMD) to track the performance of a hypothetical covered call strategy that holds long term $SPY positions that sell monthly out of the money call options with strikes nearest to the 30 delta. The results show that this strategy consistently outperforms the S&P 500.

To sum up this section:

  • Initiate a short term trade position with the intention to unload your shares while adding downside protection from collecting premiums
  • Devest holdings
  • Reduce cost basis for long term holds
  • Outperforms the S&P 500

So how do I actually generate income using covered calls?

In order to generate income using covered calls, you first need to own 100 shares of any security, either that be from a public company, index fund, or ETF. You would sell the monthly (as close to 30 days) call in order to take advantage of the exponential rate of decay due to theta.

Assuming that you don’t actually want your shares to get called, you would want to focus a bit more on the chance of profit from selling these contracts instead. Now, depending on your own risk tolerance, this is were you would decide on the contract you are selling based on the delta. Using the example from earlier:

This image has an empty alt attribute; its file name is image-6.png
$SPY call options chain on March 25, 2022 via Robinhood

The $463c April 25 call cost $3.52 with a 77.16% chance of profit. If you were to lower your delta by 10 and sell the 20 delta instead:

$SPY call options chain on March 25, 2022 via Robinhood

You would be looking at a 5% increase in the chance of profit in exchange for ($3.52 – $1.97) $1.55 in premium. If that 5% assurance to you is worth the $155 you lose from 10 delta, then you should sell the 20 delta, if not, the 30 delta. It really depends on your own risk tolerance.

Another important thing to consider when selling calls is what the implied volatility (IV) is. Understanding the historic IV as well as the current IV would allow you to maximize the premiums you collect.

Alternatively, if you don’t have enough money for this strategy you can employ a poor mans covered call. Instead of owning 100 shares, you can instead purchase a deep in the money call that is far dated, and sell a shorter dated out of the money call. This strategy is more risky and complex so not advised for beginners.

Quick pointers on covered calls

Depending on what you plan on doing with covered calls, the delta you are selling matters. Higher the delta, the higher the likelihood of the underlying being at or in the money. Further the delta, the lower likelihood of the underlying being at or in the money.

When it comes to the expiration date, go with call options that expire within the month. This is because the extrinsic value of the contracts decays at a exponential rate, especially when it comes to theta (#thetagang).

The Relationship Between Crude Oil Prices, The Economy, and The Stock Market

1 Comment

Despite recent transitions into renewable, clean, and other green energy sources within the past two decades, crude oil, also called petroleum, has seen a very gradual decline in its global market share as a fuel option. If we dig a little deeper, we can take a look at the numbers behind this.

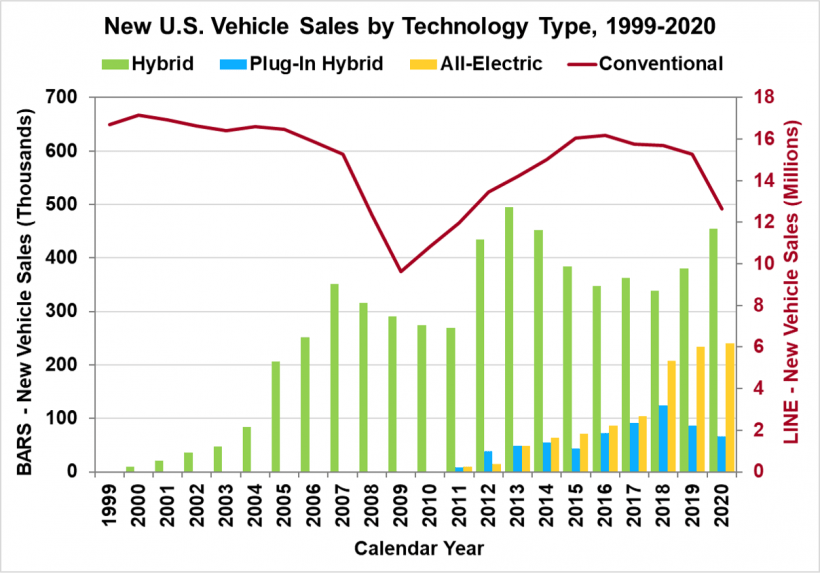
Source: U.S. Energy Information Administration, Monthly Energy Review

New vehicle sales in the U.S. shows that on average year after year, there is a slow decline in conventical vehicles while the shares for hybrid, plug-in hybrid, and all electric vehicles have all been increasing.

From 1999 to 2020, conventional vehicle sales has dropped from 17 million to about 12.5 million.

From 2000 to 2020, hybrid sales has increased from 9,400 to 454,900. 2010 to 2020, plug-in hybrid sales increased from 300 to 66,200. And all-electric vehicles grew from 10,100 thousand to 240,100. Combined, non conventional vehicle sales in 2020 accumulated to 761,200 vehicles.

Although conventional vehicle sales have been slowly decreasing, they still outnumber non-conventional vehicle sales by more than 12 times.

Source: Oak Ridge National Laboratory, Transportation Energy Data Book: Edition 39, April 2021, Table 6.2. Graph courtesy of US Department of Energy’s Office of Energy Efficiency & Renewable Energy.

Globally, there are about 1.4 billion vehicles with 20%~ being in the United States. Within the U.S., there are around 276 million registered vehicles as of 2020. But how many of these vehicles are EVs? How many use oil based fuel as a energy source? When compared to the total number of vehicles, the U.S. Department of Energy shows that there are 1,019,260 registered electric vehicles (2020), with almost half of the vehicles (425,300) being in California alone. This tells us that the number of registered electric vehicles only account for 0.4% of registered vehicles.

Zero. Point. Four. Percent. This number alone tells us that there is still a strong reliance on oil as a fuel source. However, it’s important to recognize that oil is used in more than just one way. It’s also used in consumer goods, such as cosmetics, clothes, and plastics. Oil is objectivity the most important commodity of our modern era. But with the soaring prices that we have seen in the past couple of weeks, what do these changes really effect?

Why is crude oil so important?

Making up 35% of total annual energy consumption in the U.S, petroleum heats our homes, office spaces, business, properties, while providing fuel for transportation and shipping. But that’s not all crude oil can do.

From a single 42 gallon barrel of crude oil: 19.4 is turned into gasoline, 12.5 into distillate fuel (diesel fuel: heavy construction equipment, buses, tractors, buses, boats, trains; and heating oil), 4.4 into jet fuel, 1.5 into hydrocarbon gas liquids (propane, ethane, butane), 0.5 into residual fuel, and 6.5 into over 6000 misc. petroleum products. Some of these products include popular everyday items such as: toothpaste, shaving cream, drinking cups, hair curlers, dishes, pillows, phones, clothes, glasses, and plastics.

Who are the largest oil producers in the world?

As of 2020, the top ten oil producing countries 72% of crude oil to the world, 67.49 million barrels per day out of the total 93.86 million. The United States produces the most at 18.61 million barrels per day, 20% of the global market share followed by: Saudi Arabia (10.81m, 12%), Russia (10.5m, 11%), Canada (5.23m, 6%), China (4.86m, 5%), Iraq (4.16m, 4%), United Arab Emirates (3.78m, 4%), Brazil (3.77m, 4%), Iran (3.01m, 3%), Kuwait (2.75m, 3%). These top ten countries account for 72% of the oil produced in the world.

Source: U.S. Energy Information Administration, “What countries are the top producers and consumers of oil?,” December 2021.

What about OPEC?

Founded in 1960, the Organization of Petroleum Exporting Countries, or OPEC, is a cartel of oil producing countries that determine the amount of oil that gets supplied to the world. Currently there are thirteen countries that make up this cartel which consist of Algeria, Angola, Republic of the Congo, Equatorial Guinea, Gabon, Iran, Iraq, Kuwait, Libya, Nigeria, Saudi Arabia, United Arab Emirates, and Venezuela. Since 2017, OPEC has expanded their alliance to include other oil producing countries without them formally being part of the cartel. These additions include Azerbaijan, Bahrain, Brunei, Kazakhstan, Malaysia, Mexico, Oman, Russia, South Sudan, and Sudan. Of the top 10 producing countries in the world, six are a part of OPEC+. These countries are Saudi Arabia, Russia, Iraq, United Arab Emirates, Iran, and Kuwait; accounting for 37% of the 72% share of world total.

Who are the worlds largest oil consumers in the world?

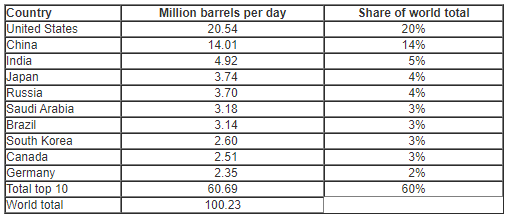
The United States tops the list again consuming 20.54 barrels of oil a day at 20% of the world total followed by: China (14.01m, 14%), India (4.92m, 5%), Japan (3.74m, 4%), Russia (3.7m, 4%), Saudi Arabia (3.18m, 3%), Brazil (3.14m, 3%), South Korea (2.6m, 3%), Canada (2.51m, 3%), Germany (2.35m, 2%), and Germany (2.35m, 2%). These top ten countries account for 60% of the worlds consumption of oil.

Source: U.S. Energy Information Administration, “What countries are the top producers and consumers of oil?,” December 2021.

How is crude oil priced?

Like most things, a contributing factor that determines the price of oil involves supply and demand. As there is more oil being supplied into the market, the price of oil goes down. If the supply of oil goes down, the price of oil goes up. Since oil is a commodity, commodities deal in the futures market via futures contract.

These contracts are binding agreements that give the contract buyer the ability to purchase barrels of oil at a predetermined price at a predetermined date in the future. Buyers of these contracts are able to trade them until end of the front month (nearest expiration date). Expiration dates vary depending on the contract. For crude oil, there are monthly expiration dates that go as far as nine years. Whoever hold these contracts at or past contract expirations is obligated to accept the barrels of oil while the seller of the contract is obligated to sell them to the buyers. The actual price of crude oil is determined in a global market place and is not determined by any single entity.

The pricing for these contracts would look similar to a log graph (see below), where the spot price of the commodity is lower than the future prices (contango):

Crude Oil Contango Example

When the forward price of a futures contact is higher than the current spot price, it means that the market is in contango. Future prices may be in contango due to factors such as insurance, shipping, storage, and even financing. Prices may change as the views of market participants may change.

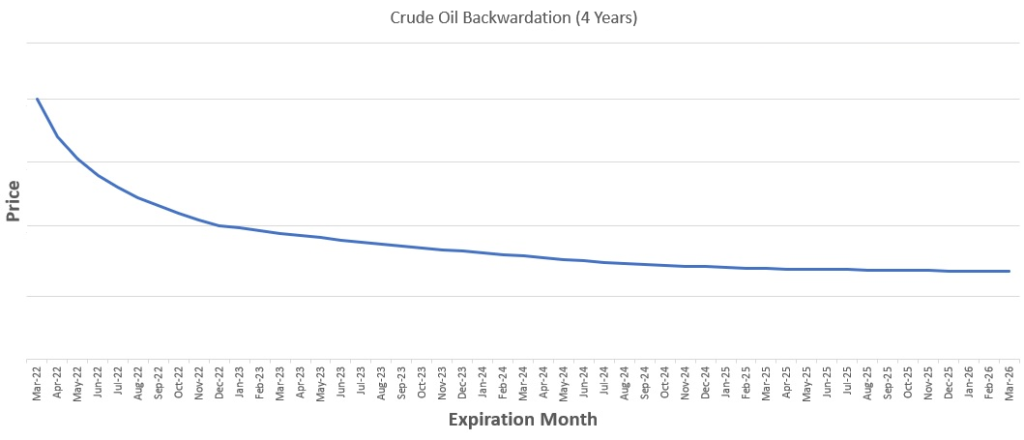
On the other hand, there is the inverse of contango which is backwardation.

Crude Oil Backwardation Example

With backwardation, the spot price of the commodity, in this case crude oil, is higher than the future price of the product resulting in a downward sloping curve. Backwardation might occur because it might be more beneficial to take physical deliveries.

As time passes by, the price of the futures contract will begin to converge with the spot price.

So what’s the relationship between oil and the economy?

As a quick reminder: when refined, a 42 gallon barrel of crude oil turns into fuel for automobiles, trucks, planes, heating and energy for buildings, industrial machinery, and made into consumer products such as cosmetics, plastics, and clothes.

When the price of crude oil goes down, businesses and consumers spend less on transportation and can take advantage of lower gasoline prices. Businesses are able to reallocate that money into reinvestments, hire more workers, and maximize productivity. Consumers are able to go out into the local economy more often, spending on goods and services that gets recirculated. In short, lower crude oil prices help stimulate the economy.

However, when the price of crude oil goes up, it causes the economy to slow down. When crude oil prices increase, that means transportation is more expensive, goods get more expensive, utilities get more expensive. Businesses that get their goods transported from different regions in their country, or even world, need to allocate more of their money towards expenses. These expenses then gets translated into the increasing price of their goods or services, essentially passing along the cost into the consumers. Because these goods and services have increased in cost, consumers would tend to buy less and use services less. Higher crude oil prices also means higher cost of fuel and energy, therefore consumers travel less, being unable to spend their money in the local economy.

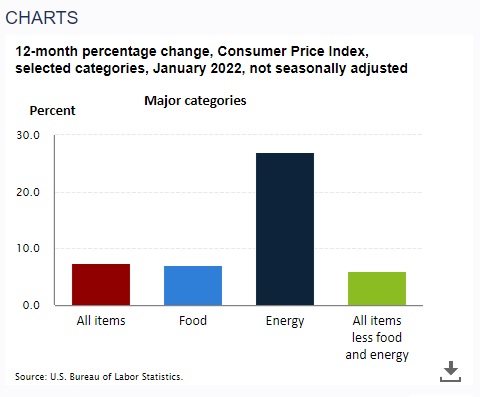
The increase and decrease in the price of energy is one of the major categories used to calculate the consumer price index (CPI) number by the U.S. Bureau of Labor Statistics (BLS). CPI is commonly used as an indicator for inflation. As of writing this post, the most recent CPI number released by the BLS is +0.6% month over month and +7.5% year over year. This means that on average, prices have increased by 0.6% from December 2021 to January 2022 and 7.5% from January 2021 to January 2022.

Energy as general category has increased by +0.9% month over month (Dec 2021 – Jan 2022) and a astonishing 27% year over year (Jan 2021 – Jan 2022). Gasoline has actually dropped by -0.8% month over month but almost doubled by 40% year over year.

Source: U.S. Bureau of Labor Statistics, “Consumer Price Index.” Jan 2022

Then what’s the relationship between crude oil and the stock market?

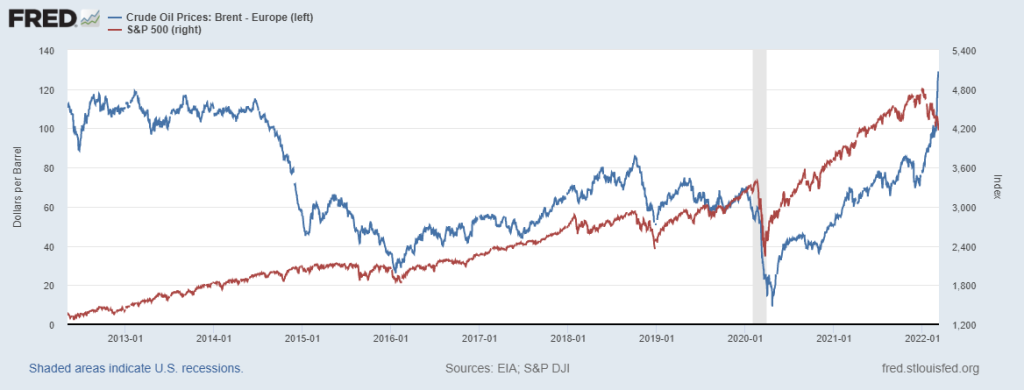
Price of Crude Oil when compared to the S&P 500

There is a common belief amongst investors that high oil prices negatively affect the stock market. It makes sense right? Increasing cost of fuel would tighten company profit margins due to higher cost of inputs. Rising cost of fuel would also have an impact on inflation and spending habits of consumers. But let’s take a step back and remind ourselves that correlation is not causation and that the economy is not the stock market.

Back in 2008, the Federal Reserve Bank of Cleveland conducted a study on the correlation between the price of oil and the growth of the S&P 500. Researchers plotted weekly price changes between the two since the beginning of January 1998 to August 2008. If higher prices of oil did affect the stocks, in this case the S&P 500 index, there would be a downward sloping line to indicate an inverse relationship.

If we took a look at the Crude Oil Price and S&P 500 graph gathered from the St. Louis Fed at the top of this section, we can see that there is a positive correlation between the two since 2016. It’s possible that the reason for this similar movement was due to shifts in global demand, which affects both corporate profits and demand for crude oil. According to former Federal Reverse Chairman Ben Bernanke, “sometimes the price of stocks and oil move in the same direction…on average, however, the correlation is positive.” The underlying demand factor of oil does account for a positive relationship between oil and stocks. With this being said, there is still many significant factors that are unexplained.

One sector that does have a strong inverse correlation with the spot price of oil is transportation. As fuel is the highest input cost for these businesses such as the airline industry, investors tend to pile into these stocks when oil is low and sell when oil is high.

Another sector that has a obvious relationship with the price of energy is the energy sector itself. When energy prices go up, the energy sector is able to profit off of these price increases. Their earnings are usually better during these times so investors buy when energy increases and sell when energy falls, therefore having a positive correlation.

The Savings Account Is Obsolete

1 Comment

There, I said what most people are thinking. The interest rate that you get for storing your hard earned cash into a savings account yields less than a tenth of a percent on average. Some of the biggest banks give a laughable 0.01%, such as Wells Fargo’s Way2Save, Bank of America Advantage Savings, and Chase Savings. The national average on the other hand is about 0.06% according to the Federal Deposit Insurance Corporation (FDIC). This, however, was not always the case.

But don’t get me wrong, there is still a strong need and even necessity to keep money in your bank account; whether that is in your checking or savings, or both, having liquidity will always be important. The real question, even concern at this point is how much money you decide to have in those accounts before you start doing anything else with your excess cash.

Decline of the APY

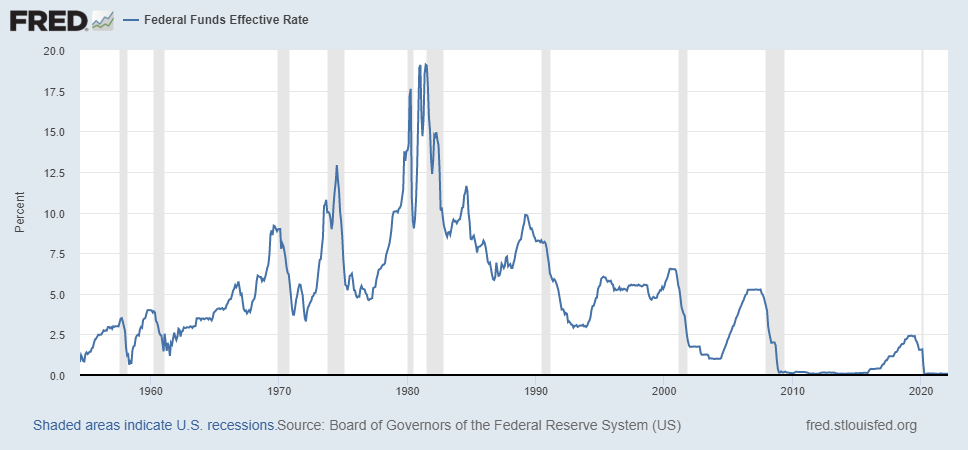
Believe it or not, saving account APY weren’t always this low. In fact, during the 1980s when the fed funds rate were at a record high of near 20%, the saving account APY were in the teens with some accounts claiming to be as high as 20% (corresponding to the fed rate). These numbers are completely unfathomable if you were to explain it to Generation Z and Generation Alpha. So the question remains: what happened to the interest rate for savings accounts?

Fed Funds Rate for the past 8 decades via St Louis Fed

To answer that question we actually need to take a step back before the 1980s and into the Carter Administration. For decades, the U.S. was struggling in its fight against stagflation, which is a combination of both high inflation and high unemployment; two things the Fed is responsible for due to their duel mandate. When President Carter was sworn into office, one of his first acts as president was to deal with the lingering issue once and for all. In a meeting with the regional fed presidents to determine the next Federal Reverse chairman, Carter met with a relatively unknown individual at the time named Paul Volcker. Volcker was only able to speak with Carter for about ten minutes, but within those ten minutes, he was able to explain his strategy to end stagflation. And when the time came, Carters nomination to become the next Federal Reverse Chair was Volcker himself. Volcker’s plan? To dramatically raise interest rates which resulted in the reduction of the supply of money, and ultimately causing a recession for the U.S. economy. This sudden increase in rates became known as the “Volcker Shock.” Unfortunately for President Carter, it is said that the Fed Chair has more power to determine the outcome of a presidential election based on their monetary policy, and considering how President Carter was a one term president, this theory holds up despite Carters actions.

Obviously the Fed Funds Rate didn’t stay at these double digit levels. Gradually over time in order to improve the economy and to encourage borrowing and spending, the rates slowly declined. Along with it was the APY for saving accounts. The Federal Deposit Insurance Corporation (FDIC) has historic savings rates that goes back to May 2009. It shows that since 2010, savings account interest rates has been on a decline where APY was at 0.19%. Since 2013, the APY for savings accounts has been sitting at 0.06% on average.

For the past two decades, the U.S. has enjoyed a low interest rate environment. The ability to borrow cheap money comes at the cost of low interest rates for their savings, and also checking’s account (which is a lower percentage than the savings rate). The cutting of rates, or in a more recent case, keeping them low, is a way to help boost the economy. Now the question is: is the trade off worth it? My answer: yes, definitely. Though it is nice to earn interest from banks by allowing them to hold your money, there are other, better ways to accumulate interest.

Store of Wealth

If the reason why you decide to store all of your wealth in your bank accounts is due to safety, I can understand that. But there are also other alternatives with the same amount of safety, if not more secure. These alternatives also offer a higher interest rate than the ones you would get from banks. I’m of course talking about government bonds. Government bonds, in this case U.S. Bonds, are low risk investments which are backed by the U.S. government. These investment securities are purchased through the U.S. Department of Treasury and earn interest over time until their date of maturity. Nowadays, you’re able to purchase these through the U.S. Treasury Department online through TreasuryDirect.

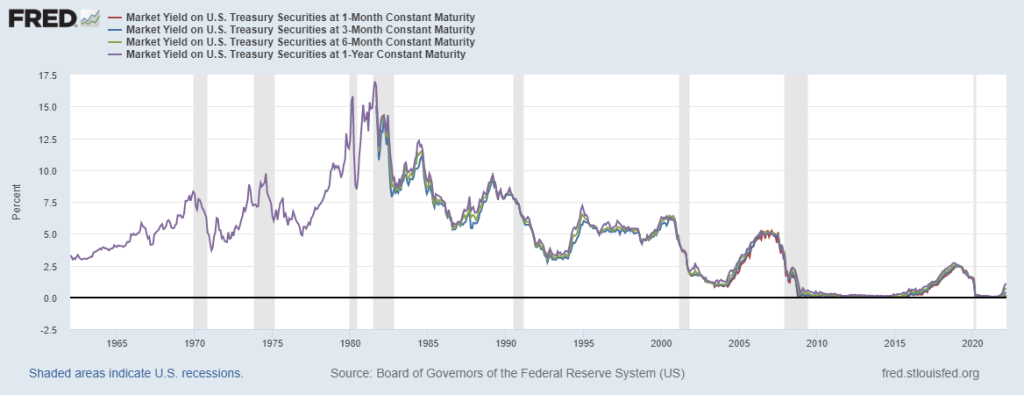
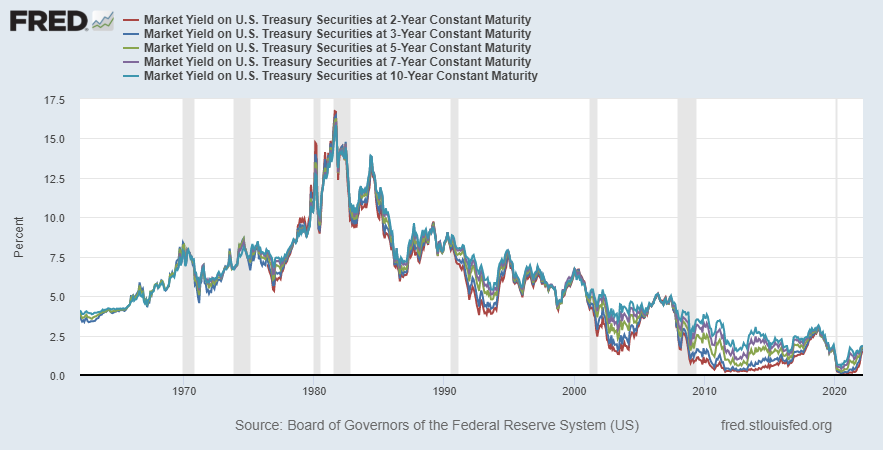
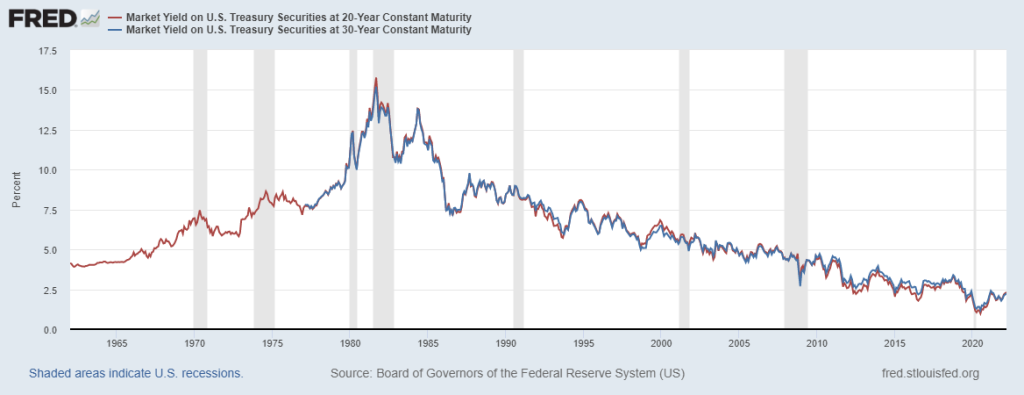
The U.S. government offers three different types of treasuries: treasury bills (T-bills) with maturity date up to one year, treasury notes (T-notes) with maturity between 2 to 10 years, and treasury bonds (T-bonds) with maturity of over 10 years. As of writing this post (March 2022), the rates on these treasuries are:

T-bill rates up to March 2022 via St Louis Fed
  • 1 Month: 0.19%
  • 3 Month: 0.38%
  • 6 Month: 0.69%
  • 1 Year: 1.08%
T-note rates up to March 2022 via St Louis Fed
  • 2 Year: 1.53%
  • 3 Year: 1.69%
  • 5 Year: 1.74%
  • 7 Year: 1.82%
  • 10 Year: 1.86%
T-bond rates up to March 2022 via St Louis Fed
  • 20 Year: 2.32%
  • 30 Year: 2.24%

Though it wasn’t necessary to show all of these treasuries, I wanted to emphasize that there is a variety to pick from. But lets just take a second and look back at the shortest maturity treasury out there: the 1 month T-bill with a 0.19% interest rate. That’s already 19x the amount saving accounts from big banks give you in interest, or about 3x as much from the average! Let that sink in for a second.

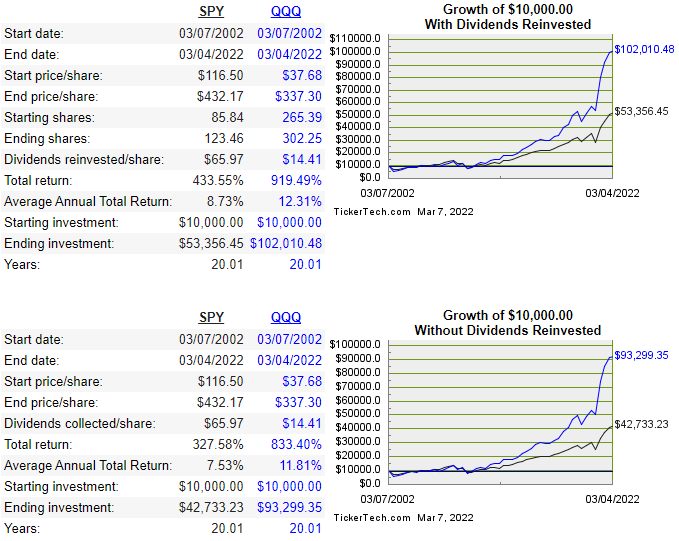
If your appetite to increase your wealth has grown but are still a bit worried about your losing your money, you could stick with index funds such as the $SPY or the $QQQ. These two essentially track the largest 500 and 100 companies trading on the stock market, respectively. Therefore, because they are essentially a diversified fund, the likelihood of losing a large chunk of money is low. But it should be noted that past performance does not indicate future returns.

10k starting with $SPY and $QQQ with and without DRIP via TickerTech.com

If you were to invest $10,000 20 years ago into one of these two funds, your portfolio would currently be worth $93.3k ($QQQ) or $42.7k ($SPY). Since these two do give out dividends, if you were to have reinvested all of that income back into acquiring more shares, you would have $102k ($QQQ) or $53.3k ($SPY). How much do you think you would have if you let that $10k sit in your bank account for 20 years? Now also consider inflation being on average 2-3% annually; in terms of purchasing power, that $10k would be worth a lot less than how much you put in.

Importance of Liquidity

Despite all of this, I still believe that the savings account has a place in our lives. We need a place to store our money, and it would be irrational to have our savings in cash hiding under our mattress. The only real viable place is to deposit that into your bank account. If all of your net worth is purely in assets, the problem comes when you need the cash for something unexpected, such as medical expenses or a totaled car. If you liquidate those assets for cash, there’s still a procedure that goes with it. You sell the assets, say stocks, you can’t just withdraw the money straight away; the brokerage you signed up for won’t let you do that. You need to let the money settle for a few days before given the ability to do so. Financial experts advise that you should at least have somewhere between three to six months worth of income in savings. But perhaps nothing over that limit. In order to really build your personal wealth, look towards other assets, such as treasuries’ if your tolerance is low or stocks if your tolerance is a bit higher. Though it’s not really seen as a method of increasing your net worth anymore, the savings account acts as the emergency fund you can rely on when you need it most. Plus, it is nice to get that tiny amount of extra money added into our accounts every once in awhile.

Why would you buy deep in the money call options?

Buying shares of a company is pretty straight forward. You look up the ticker or name of the company, place an order, and receive said shares. The only things you really need to be concerned about is what company, how many shares, and if it’s trading at a reasonable price.

When it comes to stock options, there is much more thought needed to go into your game plan. Adding to the previous list, you also need to be concerned with what strike price, expiration date, and even likelihood of the contract going in the money or not. However, if you have strong conviction about the movement of a stock, in this case to the upside, you could purchase in the money calls or out of the money calls. The use of leverage to multiply your returns is much more than just holding plain ol’ stocks; that’s the appeal of options right? But the certainty of these contracts you buy that are in and or out of the money being in the money at expiration is not 100%. Though these contracts are much cheaper, you can’t take full advantage of the intrinsic value with these contracts. They’re either only valued extrinsically (out the money) or a mix (in the money; remember that the delta is .50). By utilizing deep in the money call options, you are taking advantage of the upside potential through its intrinsic value from a shorter time frame, have protection from downside, and cost cheaper than its stock equivalent. Deep in the money call options also eliminates the anxiety associated with worrying about whether or not your contracts will be in the money.

Let’s use a real example to demonstrate these points:

I will be using the Robinhood desktop website because of it’s friendly UI with $SPY as the ticker.

As of March 3, 2022, the price of $SPY at cash close was $435.73. As a refresher, contracts that are considered to be deep in the money are at least 10% below the price of the underlying. Therefore: $435.73 * 0.90 = $391.50. I will also be using LEAPs as the contract expiration, in this case December 30, 2022. This gives us about 9 months til expiration, or 303 days. Also because these later dated contracts are priced in increments of $5, I will be using the $390 strike.

$390 12/30 call option for $SPY on March 3, 2022 via Robinhood

Remember that each contract is the equivalent of 100 shares of the underlying.

If you were to purchase 100 shares of $SPY at $435.73, that would cost you $43,573. However, by utilizing the $390c 12/30, instead of forking out a eye boggling $43.5k, this contract will cost $6,646. That’s a staggering difference of $36,927! If you were to use the same amount of capital from those 100 shares of $SPY for $390c 12/30, you could get 6 contracts. 6 contracts multiplied by 100 gives you the exposure equivalent of 600 shares, 500 more than shares for the same amount. To summarize this section:

  • 100 shares of $SPY at $435.73 = $43,573
  • 1 contract of $390c 12/30 @ $66.46 = $6,646
    • Difference of $36,927 for same exposure
  • Or with the same amount of capital:
    • 6 contracts of $390c 12/30 @ $6,646 per contract = $39,876
    • 5x the exposure while still having some money to spare

So this means at every dollar increase, the 100 share will gain $100 while the $390c 12/30 contract will have a gain of $100 (more or less depending on delta). This is only if the underlying goes up in value. On the other hand, if the underlying goes down in value, it will lose $100 per dollar loss while the contracts will lose about $100 (again, depends on delta).

There are disadvantages to using option contracts than shares of course. The biggest one being that option contracts are time restricted, and the closer to the expiration date the more extrinsic value is lost due to theta. But with deep in the money calls, that shouldn’t be too much of a concern. There’s also the disadvantage of not getting dividends. Currently, $SPY has a dividend yield of 1.33% which comes out to be $579.52 annually with 100 shares. Lastly, no matter what time frame your contracts are, realizing gains from options will always be taxed as short term capital gains.

Option contracts act like stocks but they aren’t stocks. They can be a replacement assuming that you will hold onto this position for a couple months. Usually, when individuals purchase option contracts they do not really have the intention of exercising them, but remember if shares are ultimately what you would want, you can do so if desired.